The3DApp — B2B Agent Dashboard
Shipped B2B SaaS · Product Design, UX Research, 0→1
Timeline
2025 — Shipped
Team
Solo Product Designer, working with Engineering
My Role
End-to-end product design — user research, information architecture, interaction design, and front-end development.
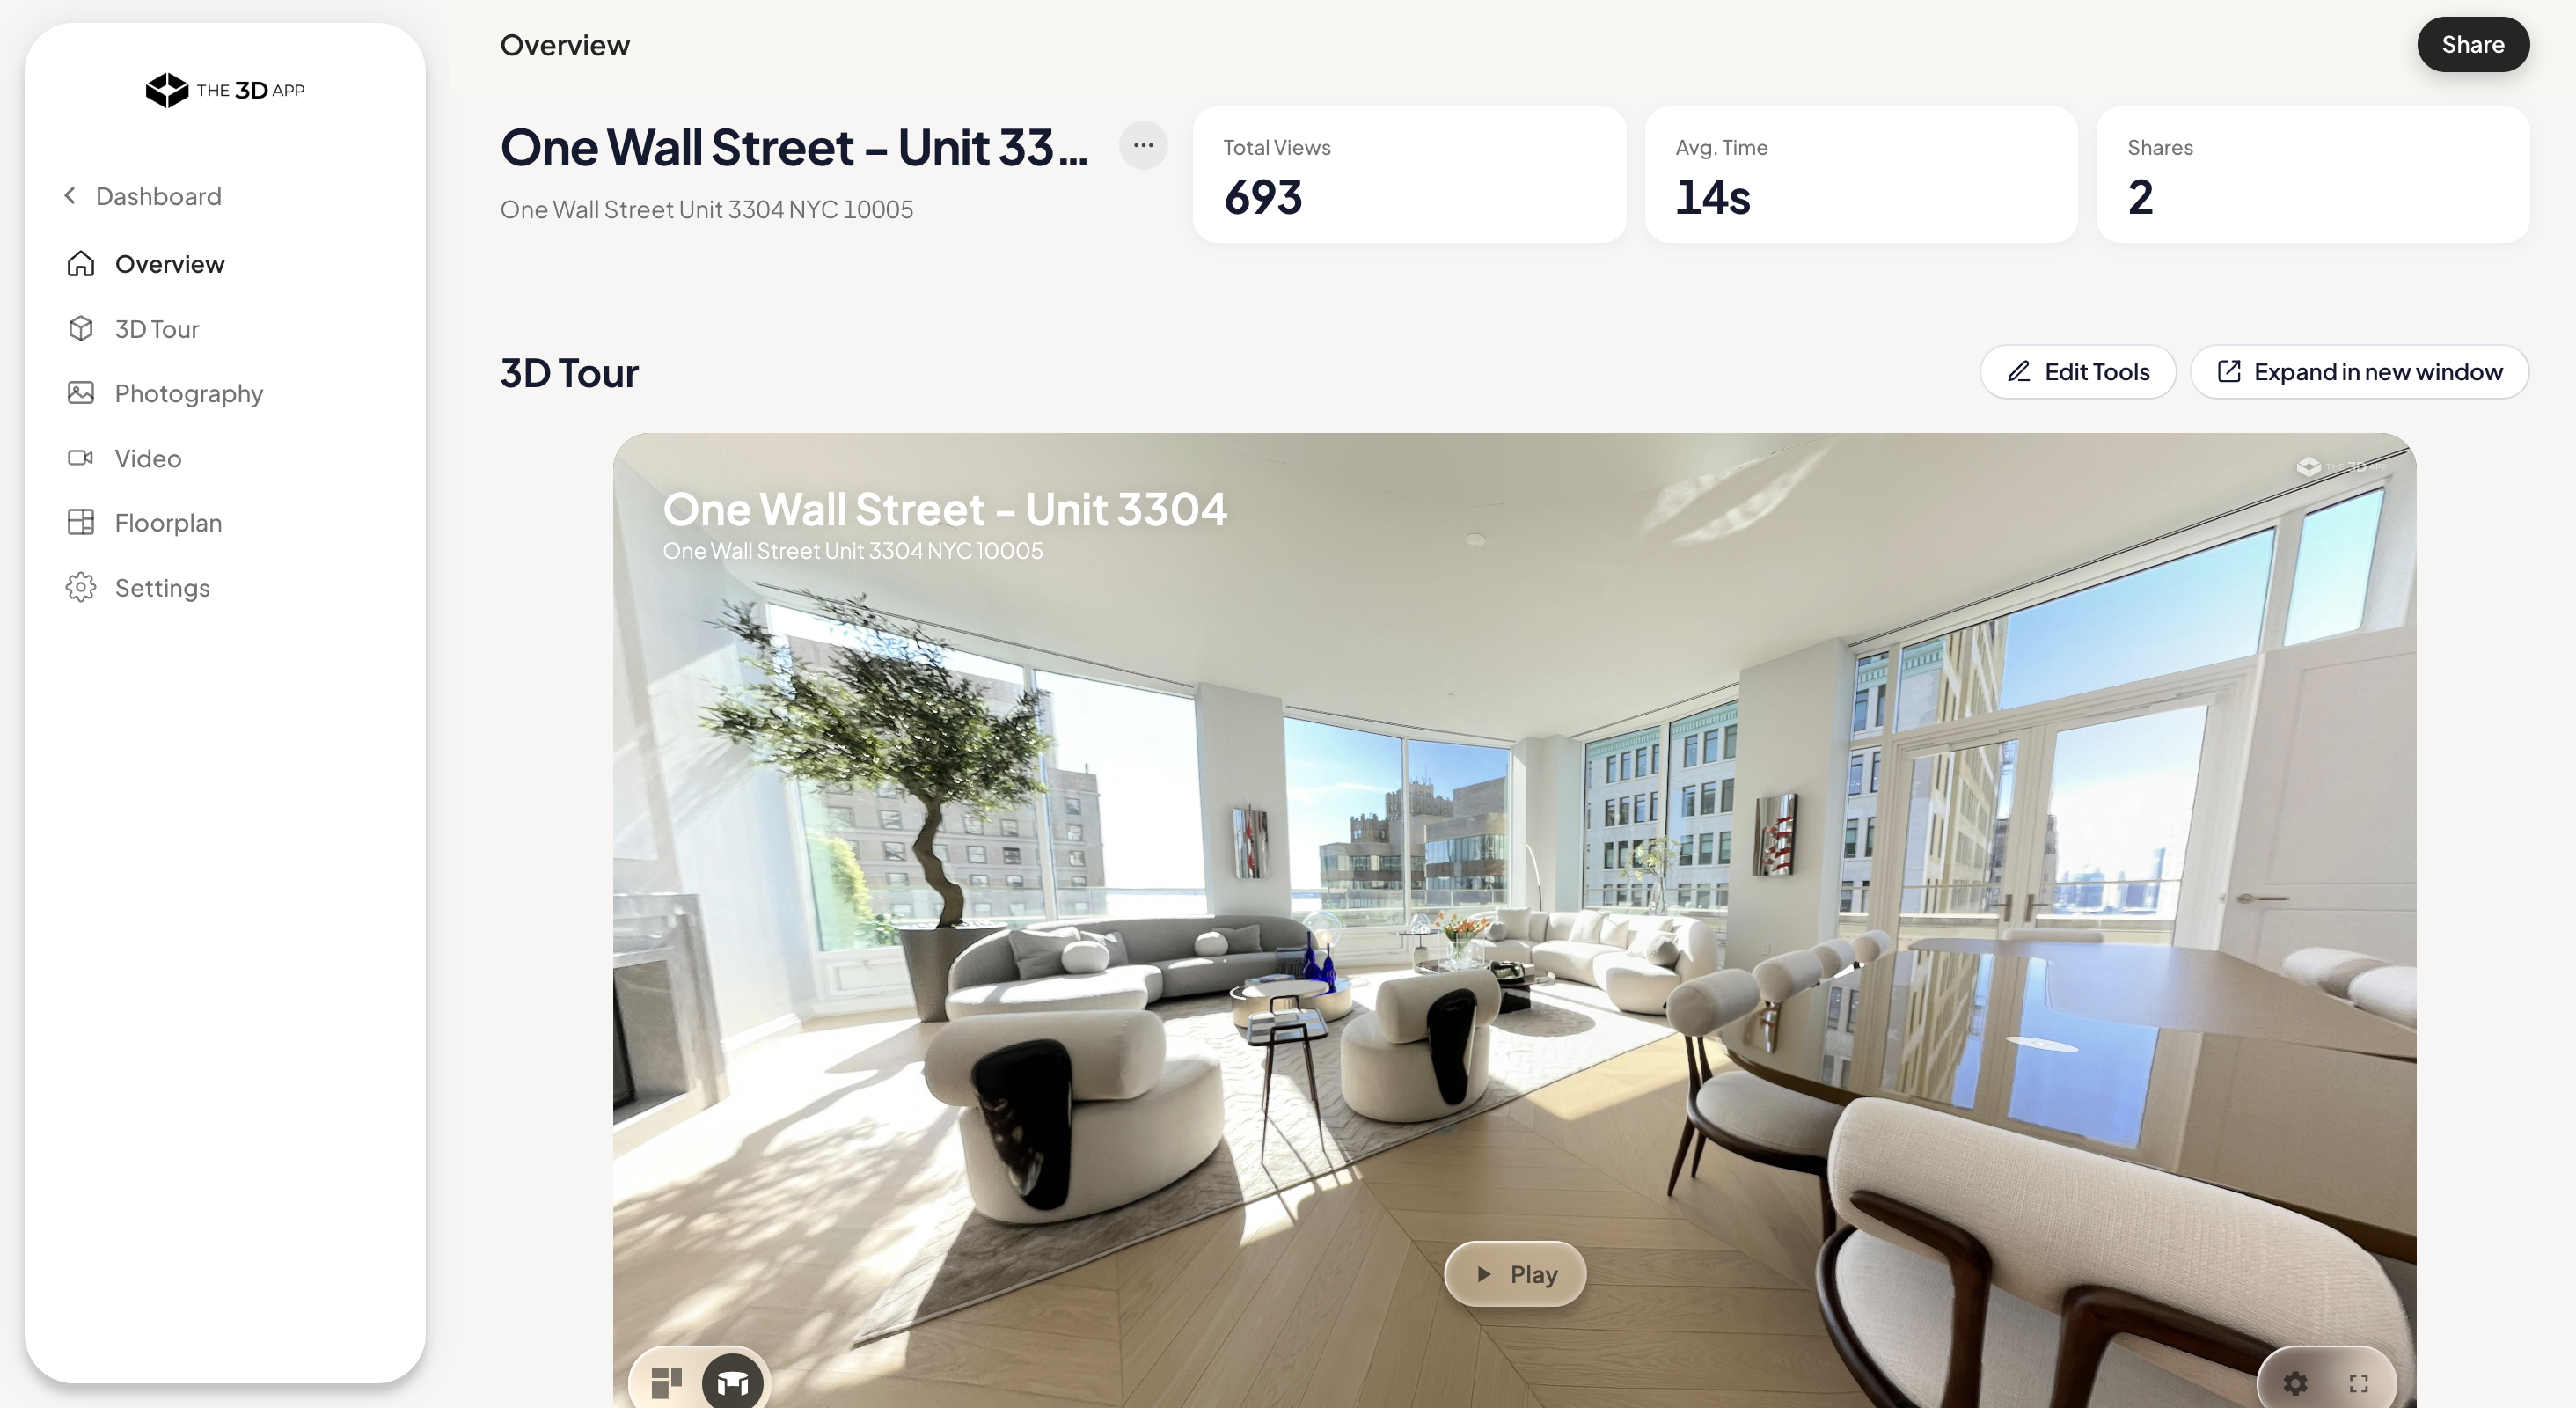
The first analytics and management dashboard for The3DApp’s real-estate agents — a 0→1 product built from user research. I designed the workflow that connects the dashboard to tours created and their resulting views & shares, turning agent activity into a measurable product loop.
The Problem
Agents had no single place to keep all of their tours together, share them, or make edits. Every tour lived somewhere different, and there was no cohesive home for the work.
Editing ran entirely through our tour artists, which created a bottleneck. We wanted to keep that support available while also giving agents direct access to their tours — so they could make changes themselves whenever they needed to.
Research
I interviewed current users, property managers, and agents to understand how they were managing tours today. The workarounds were telling: one property manager tracked the tours for her building in an Excel sheet, while an agent simply relied on tours being emailed to him one at a time.
I paired this with a competitive analysis and interviews with users of a competing app. One insight stood out — the folder feature was central to how they organized tours, and it was clearly something ours needed to have.
The Solution
A single dashboard that brings every tour into one place — organized, shareable, and editable. I led both the design and the front-end code, shipping the live dashboard, and also worked on the stager tools to make sure the embedded editing fit cleanly inside the 3D tour.
Everything on one page
Competitors split a tour’s details across separate pages you had to click through. I designed ours as a single scroll, surfacing the most important information first — so agents get the full picture without hunting for it.
A folder system
Research made it clear that organization was the missing piece — agents were tracking tours in spreadsheets or scattered email threads. Folders let them group tours the way they actually work, and share a whole folder with teammates and clients at once.
Self-serve editing
Editing used to run entirely through our tour artists. The dashboard gives agents direct access to their tours, so they can make edits themselves while artists stay free for the heavier work.
Onboarding built around real behavior
I designed the sign-on flow, then refined it from a live usability issue: a user who signed up with Google was confused by a screen asking them to type an email. We learned that agents reach for the first button they see — and most create accounts with Google — so we reordered the flow to lead with it.
The Impact
3,906
Tours brought together
Tours that were once scattered across email and spreadsheets, now organized in one dashboard.
19 / mo
New tours created each month
Tours created on average every month since the dashboard launched four months ago — a steady, measurable product loop.
5.71 / day
Daily active users
Active users on the dashboard landing page each day, averaged over the past 28 days.
Next Steps
The next piece is an email and notification system. When you’re invited to a folder, you’ll get notified right away — closing the loop between sharing a tour and knowing it landed.
And if you don’t have an account yet when you’re invited, an easy onboarding process picks up from the invitation, so a new collaborator can get in and start viewing tours with as little friction as possible.
Research also surfaced a strong appetite for deeper tour analytics — agents wanted to see which rooms clients spent the longest in, and where their attention went inside a tour. I’d like to work with developers to bring this to life, turning tour engagement into insight agents can act on.